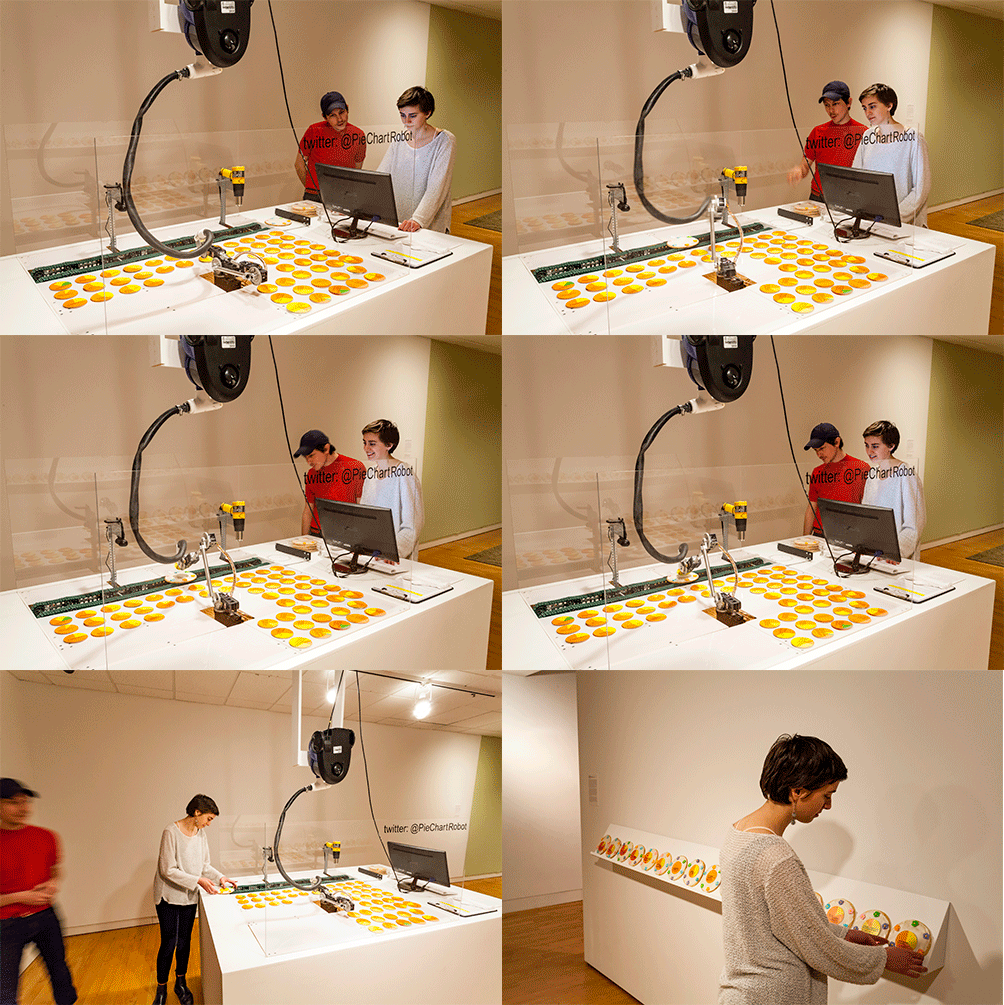
A Piece of the Pie Chart is a robotic installation consisting of a computer workstation
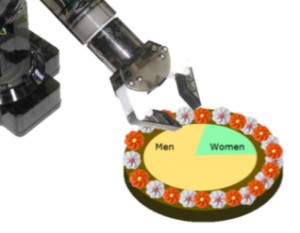
and a food robot. It also tweets. The food robot puts pie charts onto real, edible pies.

A Piece of the Pie Chart at the Miller Gallery at Carnegie Mellon University in 2017

A Piece of the Pie Chart is a robotic installation consisting of a computer workstation and a food robot. It also tweets. The food robot puts pie charts onto real, edible pies. The data on the pie charts addresses the gender gap in technical environments. They depict different gender ratios in technical environments, such as universities, companies, conferences, etc. The installation is to be displayed in a gallery setting. Visitors can use the robot to create pies. Pictures of these pies are automatically taken and disseminated via Twitter. The pies can also be mailed by the exhibition visitors to the places where the data originated to remind companies, universities, and public sector entities how large (or rather small) the piece of the pie is that women in technology can claim for themselves. Mapping gender data onto images of edible pies is a way of adding a material representation to gender statistics. It is also a way to add more urgency to the feminist cause.
As an artist, a technologist, and a woman, I am part of technology culture and have first-hand experience how technology is produced in academic and commercial settings. In the project A Piece of the Pie Chart, I focus on the gender politics of these spaces. I am using components of popular robotics kits. But instead of making the usual robotics projects like a tank, humanoid robot, or other vehicle, I am using the components to build a critical robotic technology.
The project can be seen as institutional critique for the technology world using technology-driven art involving food and robotics as a medium. I want to shed light on the complicated relationship between technology and humans and how we are all involved.
